Chapter 7 Survival Data
7.1 Cox Proportional
7.2 non-proportional model
7.2.1 log-rank test
https://www.ncbi.nlm.nih.gov/pmc/articles/PMC5898500/pdf/main.pdf
log-rank test has been the one of the most commonly used methods for non-proportional hazard model. The weighted log-rank test allow different weight assignment to time points and thererfore is able to empasize certain portion of the survivla curves.
7.3 Spline Terms in a Cox model
(ref: https://cran.r-project.org/web/packages/survival/vignettes/splines.pdf)
Cox 모형에서 비선형 관계를 표현하는 것을 실습하겠습니다.
상기 reference를 한글로 정리하고, 몇가지 visualization을 수정한 것입니다.
기초 분석
Survival package 에서 MGUS 데이터를 이용해 실습하겠습니다.
if(!require(survival)) install.packages('survival')
if(!require(tidyverse)) install.packages('tidyverse')
if(!require(ggplot2)) install.packages('ggplot2')
실습한 데이터를 살펴 보겠습니다. MGUS 데이터를 이용하겠습니다. MGUS는 monoclonal gammopathy of undetermined significance 에 대한 241명의 자료입니다. 각 변수는 아래와 같습니다.
| 변수 | 내용 |
|---|---|
| id | subject id |
| age | age in years at the detection of MGUS |
| sex | male or female |
| dxyr | year of diagnosis |
| pcdx | for subjects who progress to a plasma cell malignancy, the subtype of malignancy |
| pctime | days from MGUS until diagnosis of a plasma cell malignancy |
| futime | days from diagnosis to last follow-up |
| death | 1= follow-up is until death |
| alb | albumin level at MGUS diagnosis |
| creat | creatinine at MGUS diagnosis |
| hgb | hemoglobin at MGUS diagnosis |
| mspike | size of the monoclonal protein spike at diagnosis |
| mgus1 | The same data set in start,stop format. Contains the id, age, sex, and laboratory variable described above along with |
| start, stop | sequential intervals of time for each subject |
| status | =1 if the interval ends in an event |
| event | a factor containing the event type of censor, death, or plasma cell malignancy |
| enum | event number for each subject is 1 or 2 |
DT::datatable(mgus)첫번째 cox 모형을 만들어 보겠습니다. event에 해당하는 변수로 death를 사용하고 이때 까지 추적관찰된 기간은 futime을 이용하겠습니다. 보정 변수는 sex 그리고 index가 될, X 축이 될 변수는 age로하고, 자유도는 4로하겠습니다.
mfit = mgus %>%
  coxph(data=.,
        Surv(futime, death) ~
          sex + pspline(age, df = 4)
  )
mfit
## Call:
## coxph(formula = Surv(futime, death) ~ sex + pspline(age, df = 4),
## data = .)
##
## coef se(coef) se2 Chisq DF p
## sexmale 0.22784 0.13883 0.13820 2.69335 1.00 0.10
## pspline(age, df = 4), lin 0.06682 0.00703 0.00703 90.22974 1.00 <2e-16
## pspline(age, df = 4), non 3.44005 3.05 0.34
##
## Iterations: 5 outer, 16 Newton-Raphson
## Theta= 0.851
## Degrees of freedom for terms= 1.0 4.1
## Likelihood ratio test=108 on 5.04 df, p=<2e-16
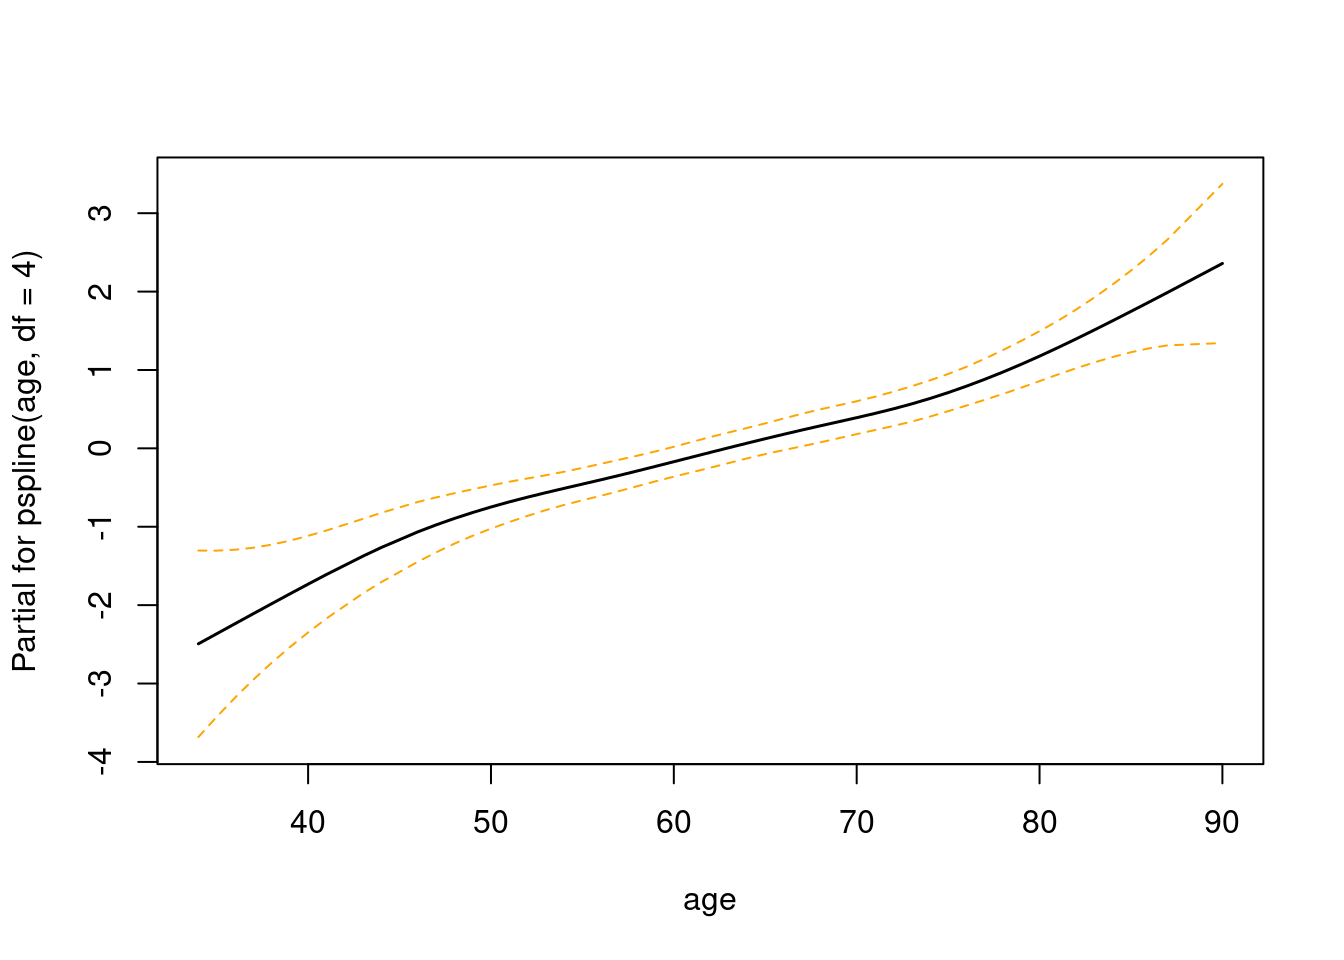
## n= 241, number of events= 225이를 기본적인 그래프로 그리면 다음과 같습니다.
우리가 두개의 변수를 이용했는데, 첫번째가 sex (terms =1) 이고 두번째가 age(terms =2) 입니다. age가 주된 관심이니 terms=2을 사용하겠습니다.
termplot(mfit, terms = 2, se = TRUE, col.term =1, col.set =1)
몇가지를 수정하기 위해 termplot의 데이터를 가져오겠습니다.
ptemp <- termplot(mfit, se = TRUE, plot = FALSE)
attributes(ptemp)
## $constant
## [1] 3.205273
##
## $names
## [1] "sex" "age"우리가 필요로 하는 것은 age에 따른 Hazard Ratio 와 Standard Error 입니다. 이제 pterm$age를 이용해 데이터를 가져오겠습니다.
ageterm <- ptemp$age
ref_score = ageterm %>% filter(x ==50) %>% pull(y)