Chapter 4 Dose Response Model
4.1 Exposure (Dose) and Health
library(tidyverse)
library(ggplot2)
library(knitr)
library(kableExtra)
영상 다운로드
우리몸에 필수 요소가 있다고 상상해 봅시다. 예를 들어 적혈구 백혈구를 생각해 보는 것입니다. 적혈구가 너무 적으면 빈혈과 같은 질병이 있는 것이고, 너무 많으면 적혈구 과다증이 있어 건강에 해롭습니다.
어떤 필수 요소가 너무 적거나 많은 상태를 질병으로, 적절한 양이 있는 경우 건강상태로 보는 것 입니다. 다음과 같은 상황을 상상해 보겠습니다.
자료 생성
trace.e <- seq(1,50, by=0.1)
#normal range = 15~35
trace.e.h=function (x) {
  ifelse(x<20, 1/(1+exp(-x+10)),
         ifelse(x<30, rnorm(1, 1/(1+exp(-19)), 0.01),
                1/(1+exp(-19))-1/(1+exp(40-x))
                )
        )
  }
hstatus<-trace.e.h(trace.e)+rnorm(length(trace.e), 1, 0.1)
basic = tibble(trace.e, hstatus)
그림 그리기
이러한 관계를 그림으로 그려 보겠습니다. 기능적 측면에서 생물학적 필수 요소가 너무 적거나 너무 많으면 사망하거나 질병이 있는 상태로, 절적 수준이 유지되는 것을 정상상태로 볼 수 있습니다.
basic %>%
  ggplot(aes(x= trace.e, y = hstatus)) +
  scale_x_continuous(name="Biological Element") +
  scale_y_continuous(name="Function") +
  theme_minimal()+
  geom_rect(data=basic[1,],aes(xmin=-Inf, xmax=7 , ymin=-Inf, ymax=Inf), fill= 'grey', alpha=0.8) +
  geom_rect(data=basic[1,],aes(xmin=7,    xmax=15, ymin=-Inf, ymax=Inf), fill= 'grey', alpha=0.5) +
  geom_rect(data=basic[1,],aes(xmin=15,   xmax=35, ymin=-Inf, ymax=Inf), fill= 'grey', alpha=0.3) +
  geom_rect(data=basic[1,],aes(xmin=35,   xmax=43, ymin=-Inf, ymax=Inf), fill= 'grey', alpha=0.5) +
  geom_rect(data=basic[1,],aes(xmin=43,   xmax=52, ymin=-Inf, ymax=Inf), fill= 'grey', alpha=0.8) +
  geom_point(size=1, color = 'grey50') +
  annotate(geom="text", x=c(3,47),  y=c(1.3, 1.3), label="Death",    color="red") +
  annotate(geom="text", x=c(10,38), y=c(1.5, 1.5), label="Disease",  color="black") +
annotate(geom="text", x=25, y=1.7, label="Normal Function",color="blue") 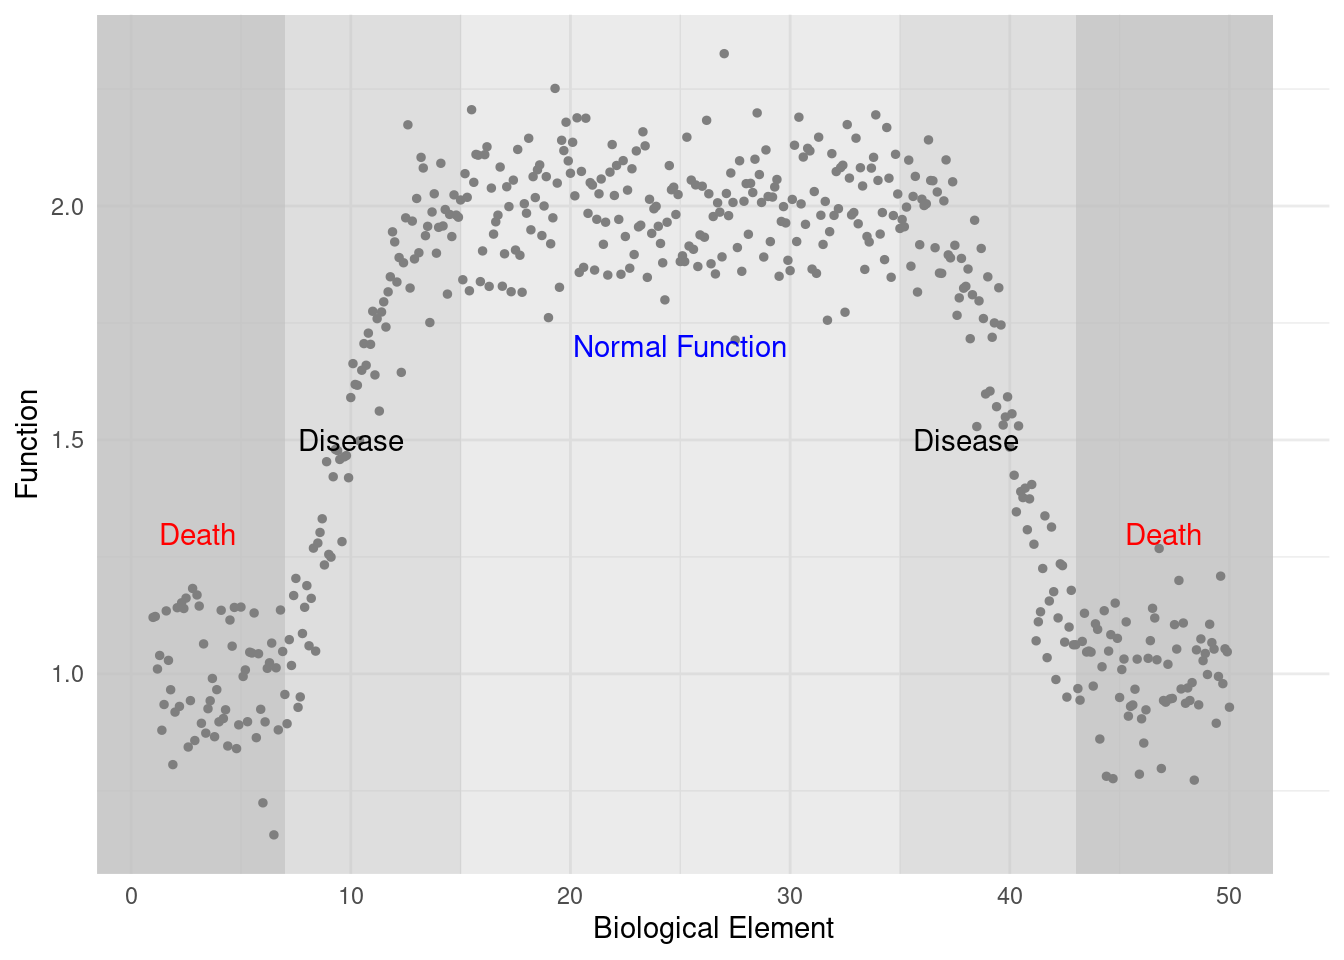
위의 그림을 Y축을 적혈구의 기능 측면에서 본 것으로 상상해보면 이해가 갑니다. 다음에는 적혈구의 가능을 악화시키는 물질에 노출되었다고 상상하고 기능이 아닌 질병 측면에서 볼 수 있습니다. 거꾸로 그래프를 뒤집을 수 있습니다.
4.2 실습 1: 질병 그림 그리기
basic = basic %>%
  mutate(disease = -1*hstatus+5,
         exp.b   = -1*trace.e +50)
fig1 = basic  %>%
  ggplot(aes(x= exp.b, y = disease))+
  theme_minimal()+
  scale_x_continuous(name="Biomarker") +
  scale_y_continuous(name="Disease") +
  geom_rect(data=basic[1,],aes(xmin=-Inf, xmax=7 , ymin=-Inf, ymax=Inf), fill= 'grey', alpha=0.8) +
  geom_rect(data=basic[1,],aes(xmin=7,    xmax=15, ymin=-Inf, ymax=Inf), fill= 'grey', alpha=0.5) +
  geom_rect(data=basic[1,],aes(xmin=15,   xmax=35, ymin=-Inf, ymax=Inf), fill= 'grey', alpha=0.3) +
  geom_rect(data=basic[1,],aes(xmin=35,   xmax=43, ymin=-Inf, ymax=Inf), fill= 'grey', alpha=0.5) +
  geom_rect(data=basic[1,],aes(xmin=43,   xmax=52, ymin=-Inf, ymax=Inf), fill= 'grey', alpha=0.8) +
  geom_point(size=1, color = 'orange') +
  annotate(geom="text", x=c(3,47),  y=c(3.7, 3.7), label="Death",    color="red") +
  annotate(geom="text", x=c(10,38), y=c(3.5, 3.5), label="Disease",  color="black") +
  annotate(geom="text", x=25,       y=3.3,         label="Normal Function",color="blue")
fig1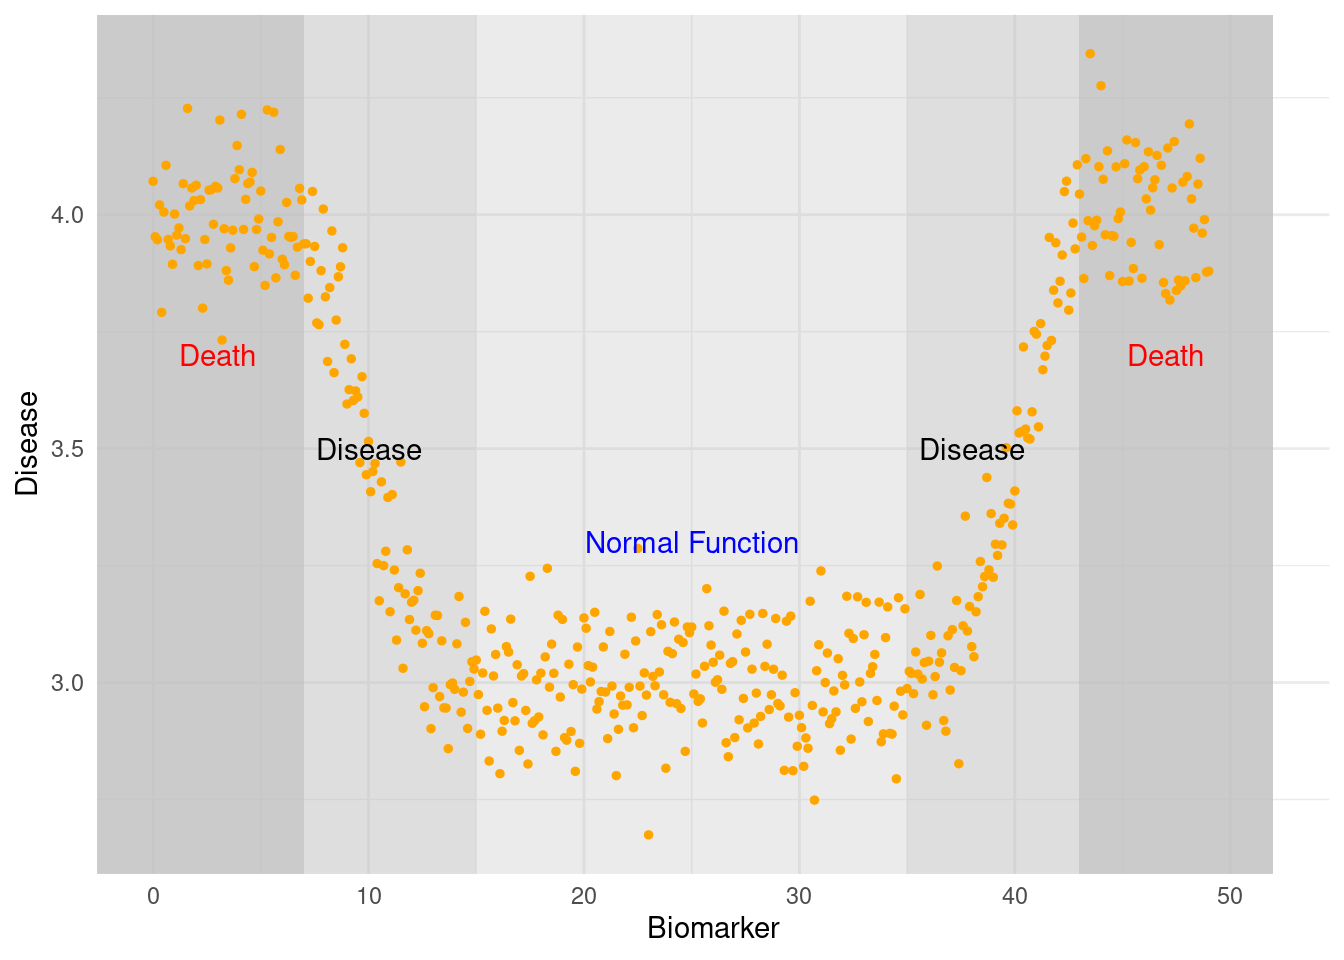
4.3 지역사회 연구 (community base cohort study)
지역사회 연구에서는 질병이 있는 사람 또는 기능이 약화된 사람은 병원에 입원해 있는 등 사회생활이 어려우므로 참여하지 못할 수 있습니다. 따라서 장기간 추적 관찰을 하지 않는 경우 바이오마커와 질병간에 U-shap 을 보이게 됩니다. 장기 관찰을 하거나 충분한 관찰을 하면 질병이 새로 생기는 부분을 찾을 수 있으므로 J-shap으로 보일 수 도 있습니다. 우리가 과거력이 있는 사람 또는 적절한 방법으로 건강이 악화되어 있는 사람을 제외하는 경우 바이오마커와 질병의 선형적 관계를 관찰할 수 있는 경우 입니다.
fig1 +
  annotate(geom="text", x=c(7, 43),  y=c(3.3, 3.3), label="Hospital (selection bias)",  color="grey50") +
  annotate(geom="text", x=c(10),  y=c(3.8), label="Short term follow up",  color="purple") +
  geom_segment(aes(x=10, xend=40, y=3.7, yend=3.7), size = 0.5, color='grey50',
               arrow = arrow(length = unit(0.2, "cm"), type = "closed")) +
  annotate(geom="text", x=c(30),  y=c(4.1), label="Long term follow up",  color="purple") +
  geom_segment(aes(x=10, xend=50, y=4, yend=4), size = 0.5, color='grey50',
               arrow = arrow(length = unit(0.2, "cm"), type = "closed"))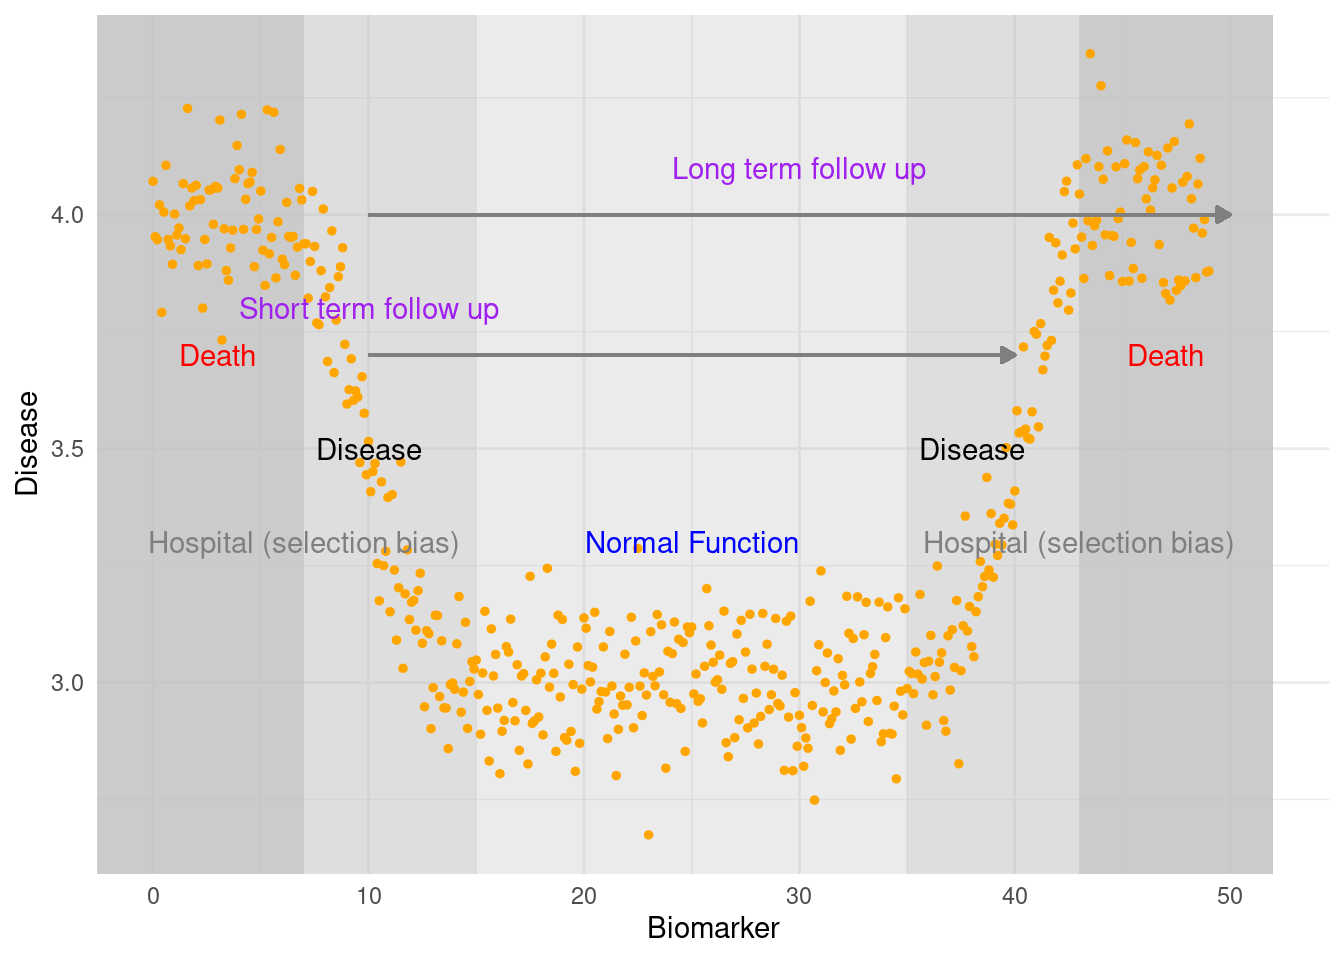
산업보건에서는 건강한 근로자가 직장을 갖고 직장을 갖은 후에 일에 따라 물리화학적 인자에 노출이 됩니다. 만약 위의 그림에서 바이오마커가 일을하면서 노출되는 유해인자와 관련이 있다면, 사업장에서는 바이오마커가 매우 낮은 사람은 없을 것입니다. 그리고 유해인자에 노출이 많이 되어 질병이 생기고 병원에 가게된다면, 사업장을 중심으로 연구하는 경우 연구대상에 참여하지 못하게 됩니다. 즉 위의 그림에서 short-term follow up 의 상황이 발생하게 됩니다. 그런데 장기간 관찰하고 퇴사후의 자료도 이용한다면 long term follow up 과 같이 가게됩니다. 이때 상관 분석을 수행하면 short-term follow up에서는 U-shap으로, long term follow up 에서는 J-shap 으로 나타나게 됩니다. 실제 연구에서도 비슷한 상황이 발생하기도 합니다. 이때 우리가 얻은 데이터가 무엇을 목적으로 어떠한 설계로 만들어 졌는지를 관찰하고 정말 질병이 생길만한 사람을 제외한 현장에서 연구를 수행하고 있는 것은 아닌지 고민해 보아야 합니다.
4.4 모형 차이: sigmoid curve vs linear regression
위의 그래프를 절반을 나누어서 적절한 기능을 하고 있는 사람만을 대상으로 장기간 추적관찰했다고 가정해 보겠습니다. 그러면 바이오마커와 질병의 관계를 선형으로 예측할 수도 있습니다. 노출이 지속되더라도 건강의 악화는 어느정도 포화될수 있으므로 (모두 다 계속 사망하지는 않으므로) 노출의 크기와 질병의 관계는 sigmoid curve 관계가 있을 수 있습니다. 어떤게 좋을까요? 정답은 없지만 LD50을 고려해서 생각해 보겠습니다. LD50이란 노출된 사람 중의 50%가 사망하는 농도를 의미합니다. 즉 LD50가 큰 물질은 적은 물질보다 많이 노출되어야 노출된 사람 중의 50%가 사망하므로 더 안전한 물질입니다.
sigmoid.f = function(x){
  1/(1+exp(5-x))
}

df = tibble(
dose.e = c(1:10),
resp   = sigmoid.f(dose.e)
)
df %>% kbl() %>%
kable_paper("hover", full_width = F)| dose.e | resp |
|---|---|
| 1 | 0.0179862 |
| 2 | 0.0474259 |
| 3 | 0.1192029 |
| 4 | 0.2689414 |
| 5 | 0.5000000 |
| 6 | 0.7310586 |
| 7 | 0.8807971 |
| 8 | 0.9525741 |
| 9 | 0.9820138 |
| 10 | 0.9933071 |
plot(df)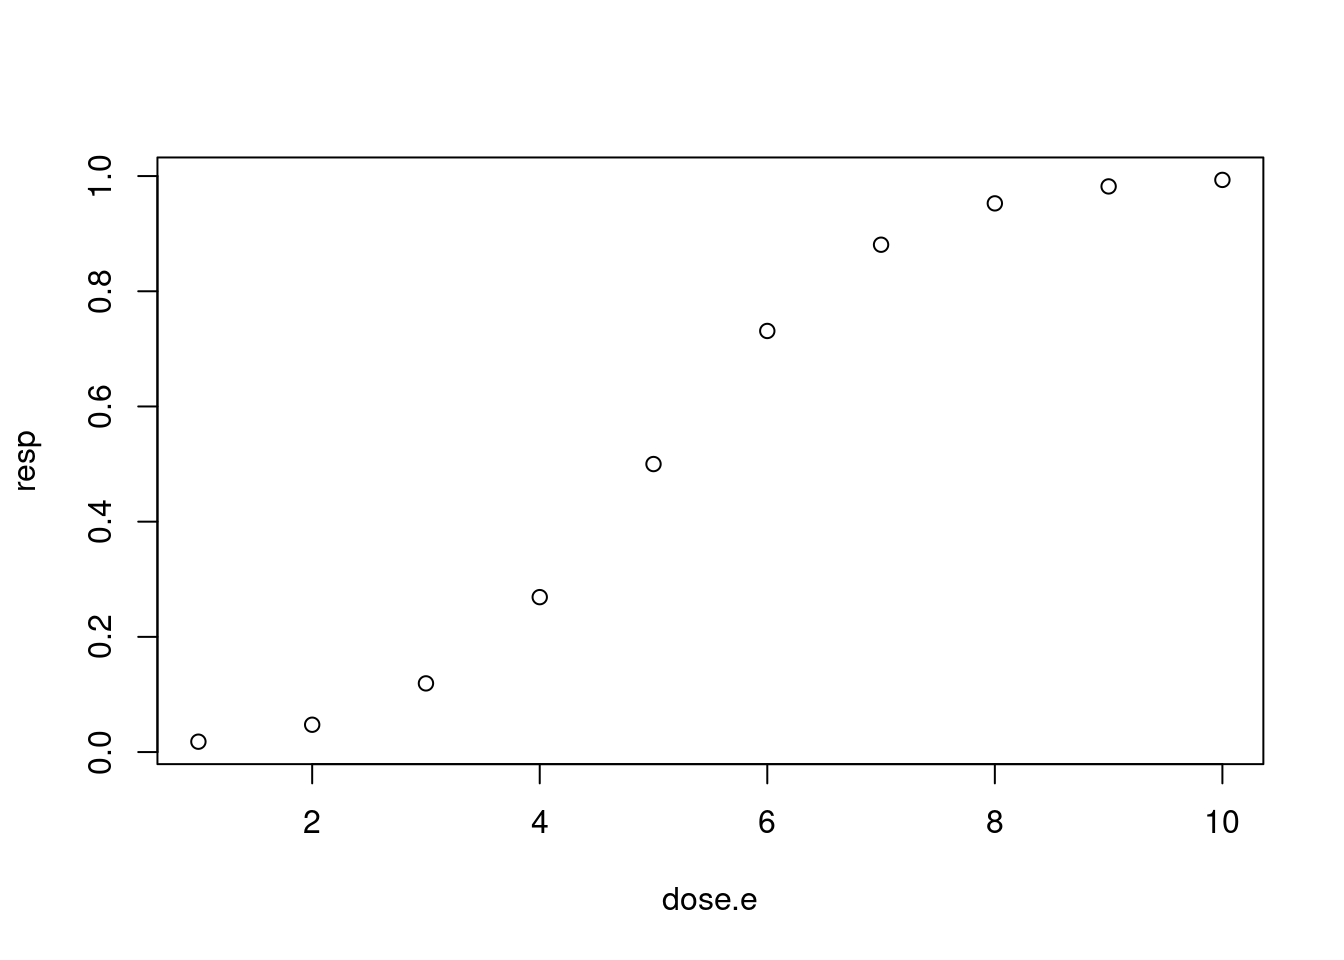
LD50은 설명을 했고, 과도한 비교를 위해서 LD70을 보고 이야기 해보겠습니다.
set.seed(50)
x<-seq(0, 10, 0.01)
y<-sigmoid.f(x)+rnorm(length(x), mean=0, sd=0.1)
pb<-c(rnorm(500, 0, 0.001), rnorm(300, 0, 0.01), rnorm(100, 0.1, 0.05),rnorm(101, -0.1, 0.05))
resp = y + pb
ld70.sm = x[which( sigmoid.f(x) >0.69 & sigmoid.f(x) < 0.71)] %>% min(.)
ld70.sm
## [1] 5.81mod1<-glm(resp ~ poly(x, 1))
pred1<-predict(mod1)
ld70.lm = x[which(pred1 >0.69 & pred1 <0.71)] %>% min(.)
ld70.lm## [1] 6.47df = tibble(dose = x, response= resp)
df %>%
ggplot(aes(x=dose, y=response)) +
geom_point(color = 'grey80') + theme_minimal()+
geom_line(aes(y= sigmoid.f(dose)), color ='red') +
geom_line(aes(y= predict(lm(response ~ poly(dose, 1)))), color ='blue') +
geom_vline(xintercept = 5, linetype=2, color='grey50') +
geom_hline(yintercept = 0.7, linetype=2, color='grey50') +
annotate(geom="text", x=ld70.sm -1, y=0.9, label="LD70",
color="purple", hjust=1) +
geom_segment(aes(x=ld70.sm -1, xend=ld70.sm, y=0.85, yend=0.7), size = 0.1, color='grey30',
arrow = arrow(length = unit(0.2, "cm"), type = "closed")) +
annotate(geom="text", x=ld70.lm +1, y=0.0, label="LD70 by linear assumption",
color="purple", hjust=0) +
geom_segment(aes(x=ld70.lm +1, xend=ld70.lm, y=0.05, yend=0.7), size = 0.1, color='grey30',
arrow = arrow(length = unit(0.2, "cm"), type = "closed"))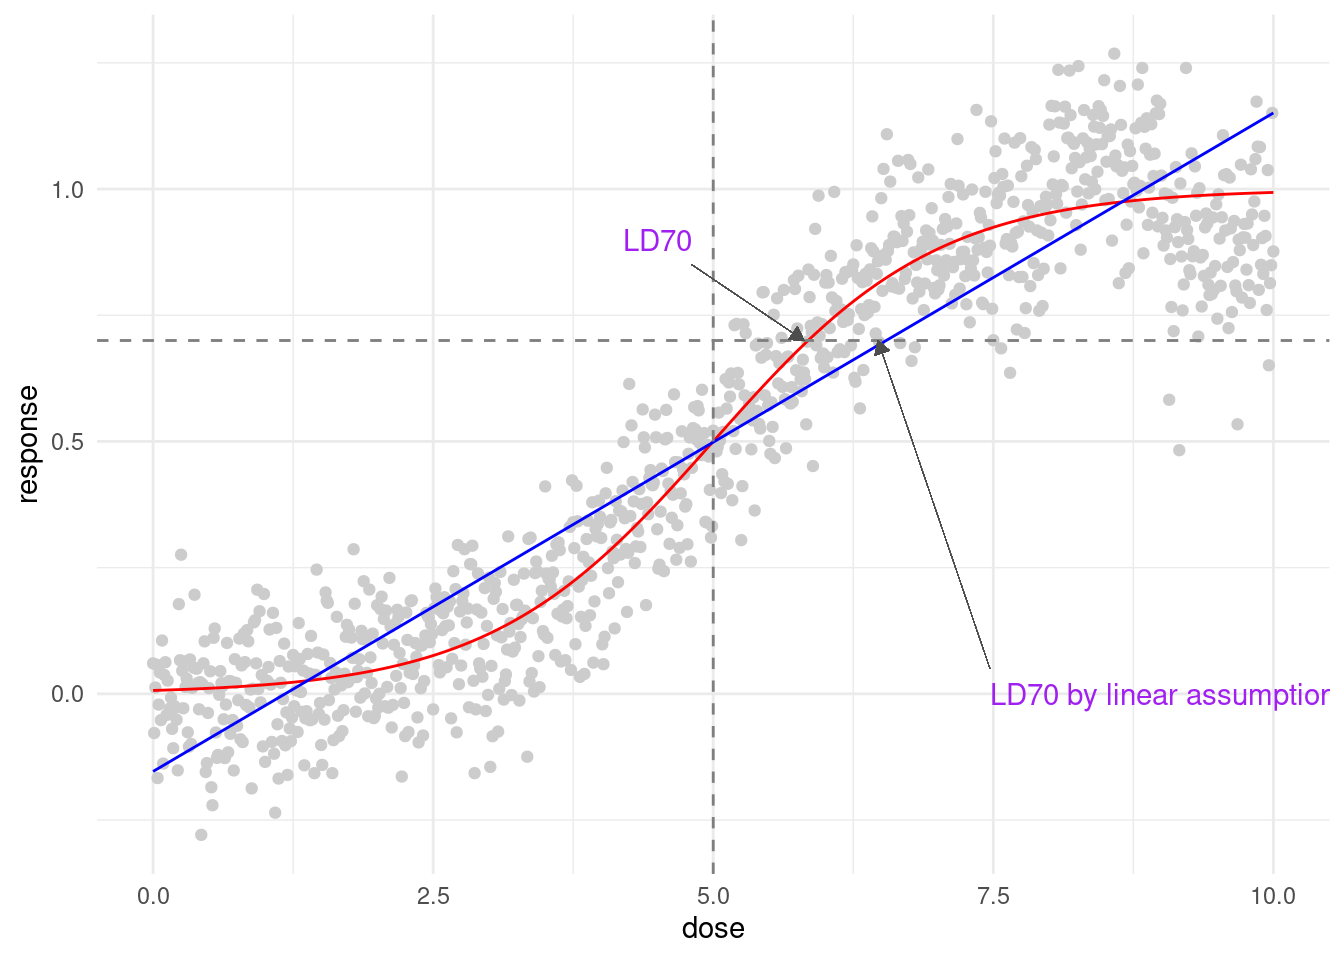
가상의 자료입니다. 그래도 중요하게 기억할 점은 선형과 비선형 커브로 할 경우 LD70이 달라지고, 독성에 대한 설명이 달라집니다. 따라서 어떠한 방식으로 설명할지 꼭 고민해야 합니다.
저 농도나 고농도에서는 더 큰 차이가 나타납니다. 그런데 대 부분 저농도의 노동자 들이나 고농도 노출의 노동자가 연구에 참여하기 어려운 상황이 발생합니다. 앞서 계속해서 이야기하는 건강근로자 효과 등을 상기 시켜 봅시다.
그럼 어떤 모델이 가장 적당할 까요? 우선 모델 적합도를 설명도로 비교해 볼 수 있습니다.
4.5 코호트 특성에 따른 상황
첫 수업 시간에 이야기한 것 처럼, 처음에는 질병이 생긴 노동자 위주로 연구가 진행되게 됩니다. 따라서 고농도 노출자 이면서 질병이 있는 사람으로 구성된 데이터에서는 상대적으로 높은 농도에서 질병이 발생하는 연구 결과과 발표 되기도 합니다. 그리고 그림에서 보듯이 선형관계를 고민하지 않는 다면 어디를 기준으로 해야할지 알 수 없는 상태입니다.
결론적으로 위험하다 는 알수 있지만, 얼마나 위험하다는 아직 연구가 되지 않은 상태라는 것을 기억해야 합니다.
early_cohort = df %>% filter(dose > 5)

df %>%
  ggplot(aes(x=dose, y=response)) +
  geom_point(color = 'grey80') + theme_minimal()+
  geom_line(aes(y= sigmoid.f(dose)), color ='red') +
  geom_line(aes(y= predict(lm(response ~ dose))), color ='blue') +
  geom_vline(xintercept =   5, linetype=2, color='grey50') +
  geom_hline(yintercept = 0.7, linetype=2, color='grey50') +
  ## add 1
  annotate(geom="text", x=c(7.5),  y=c(-0.2),
           label="Early cohort (hospital base)",  color="purple", hjust=0) +
  geom_rect(data=df[1,],aes(xmin=-Inf,   xmax=5, ymin=-Inf, ymax=Inf),
            fill= 'grey', alpha=0.6) +
  geom_line(data= early_cohort,
              aes(y= predict(lm(response ~ poly(dose,3)))), color ='orange', size = 2) +
   annotate(geom="text", x=ld70.sm -1,  y=0.9, label="LD70",
           color="purple", hjust=1) +
  geom_segment(aes(x=ld70.sm -1, xend=ld70.sm, y=0.85, yend=0.7), size = 0.1, color='grey30',
               arrow = arrow(length = unit(0.2, "cm"), type = "closed")) +
  annotate(geom="text", x=ld70.lm +1,  y=0.0, label="LD70 by linear assumption",
           color="purple", hjust=0) +
  geom_segment(aes(x=ld70.lm +1, xend=ld70.lm, y=0.05, yend=0.7), size = 0.1, color='grey30',
               arrow = arrow(length = unit(0.2, "cm"), type = "closed"))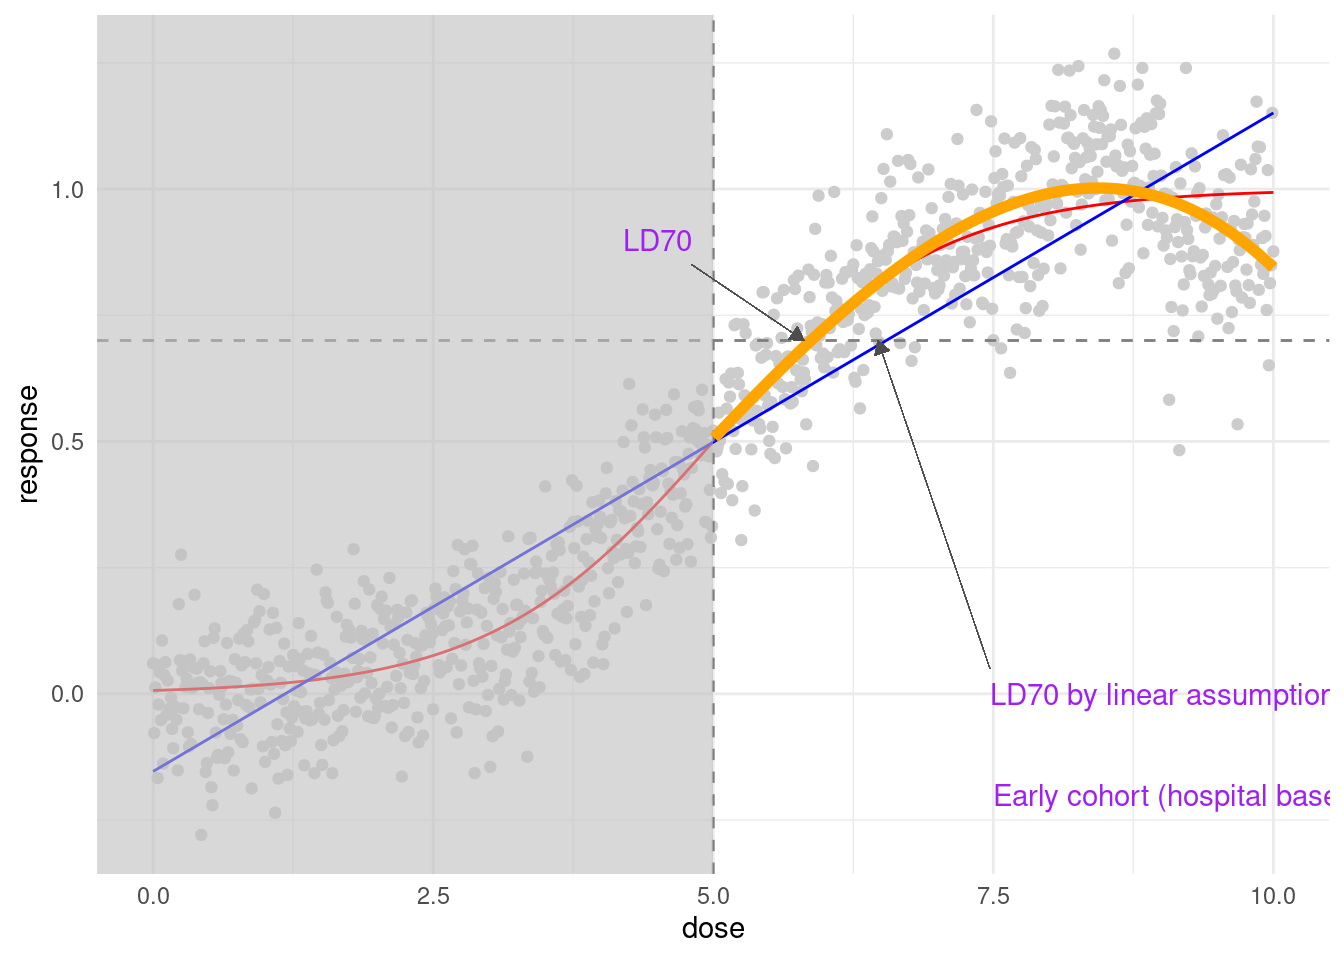
4.6 코호트 특성에 따른 상황과 이론적 모델
어느정도 잘 갖추어진 코호트를 생각해 보겠습니다. Dose 2 부터 노출된 사람을 대상으로 하였다고 가정하겠습니다.
# subcohort 2nd phase (1st phase is hospital base cohort)
s2c <- df %>% filter(dose >2)
s2m1<-lm(data=s2c, response ~ poly(dose, 1))
s2m2<-lm(data=s2c, response ~ poly(dose, 2))
s2m3<-lm(data=s2c, response ~ poly(dose, 3))
s2m4<-lm(data=s2c, response ~ poly(dose, 4))
df %>%
ggplot(aes(x=dose, y=response)) +
geom_point(color = 'grey80') + theme_minimal()+
geom_point(data=s2c, color = 'grey40', size =2 ) +
geom_line(data=s2c, aes(y=predict(s2m1)), color = 'chocolate1', size = 1) +
geom_line(data=s2c, aes(y=predict(s2m2)), color = 'chartreuse1', size = 1) +
geom_line(data=s2c, aes(y=predict(s2m3)), color = 'cadetblue1', size = 1) +
geom_line(data=s2c, aes(y=predict(s2m4)), color = 'deeppink1', size = 1) 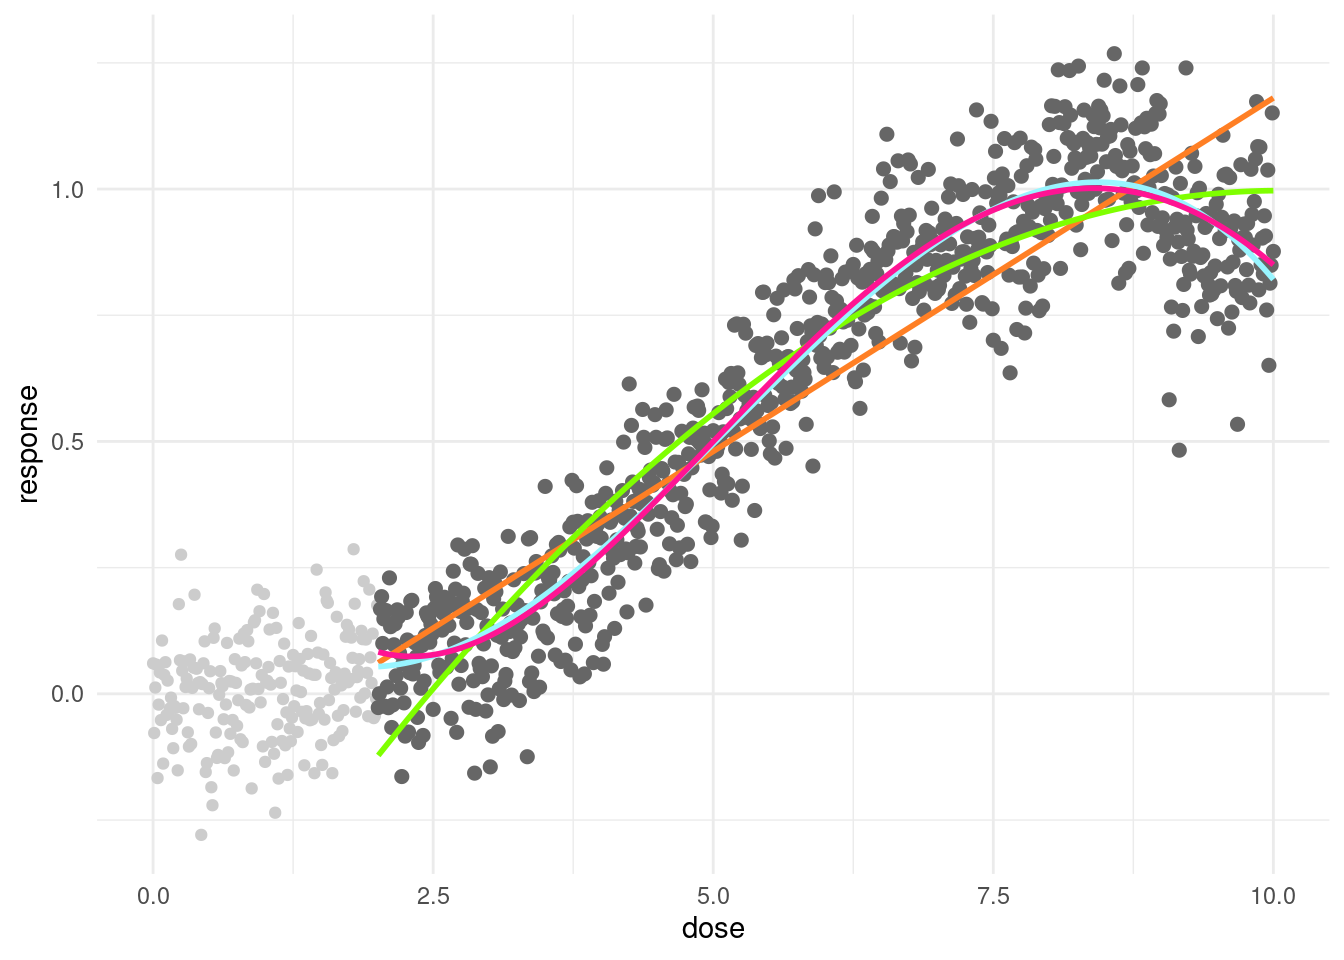 모델로 보면 선형 예측이 모형 적합도가 가장 낮다(low)고 나타나고 차수가 높을 수록 좋다고 나타나고 있습니다. 그런데, 어떤게 더 맞을 까요?.
anova(s2m1, s2m2, s2m3, s2m4) ## Analysis of Variance Table
##
## Model 1: response ~ poly(dose, 1)
## Model 2: response ~ poly(dose, 2)
## Model 3: response ~ poly(dose, 3)
## Model 4: response ~ poly(dose, 4)
## Res.Df RSS Df Sum of Sq F Pr(>F)
## 1 798 18.9099
## 2 797 13.4734 1 5.4365 440.8574 < 2e-16 ***
## 3 796 9.8806 1 3.5928 291.3455 < 2e-16 ***
## 4 795 9.8036 1 0.0770 6.2423 0.01267 *
## ---
## Signif. codes: 0 '***' 0.001 '**' 0.01 '*' 0.05 '.' 0.1 ' ' 1만약 농도가 높을 때 낮아지고 있는 부분을 고려한다면 어떻게 될까요? (실제로도 농도가 높은 곳에 근무하는 노동자는 만성 질병이 일어나기 전에 손상으로 사망하는 연구가 있습니다. ) 따라서 그런 산업보건적 특성을 고려하면 어떻게 될 까요? 단순하게 9 이상 농도를 고려하지 않도록 하겠습니다.
s3c <- df %>% filter(dose >2) %>% filter(dose <9)
s3m1<-lm(data=s3c, response ~ poly(dose, 1))
s3m2<-lm(data=s3c, response ~ poly(dose, 2))
s3m3<-lm(data=s3c, response ~ poly(dose, 3))
s3m4<-lm(data=s3c, response ~ poly(dose, 4))

df %>%
  ggplot(aes(x=dose, y=response)) +
  geom_point(color = 'grey80') + theme_minimal()+
  geom_point(data=s3c, color = 'grey40', size =2   ) +
  #geom_line(data=s2c, aes(y=predict(s2m1)), color = 'grey30', size = 1) +
  geom_line(data=s2c, aes(y=predict(s2m4)), color = 'grey30', size = 1) +
  #geom_line(data=s3c, aes(y=predict(s3m1)), color = 'orange', size = 1)
geom_line(data=s3c, aes(y=predict(s3m4)), color = 'orange', size = 1) 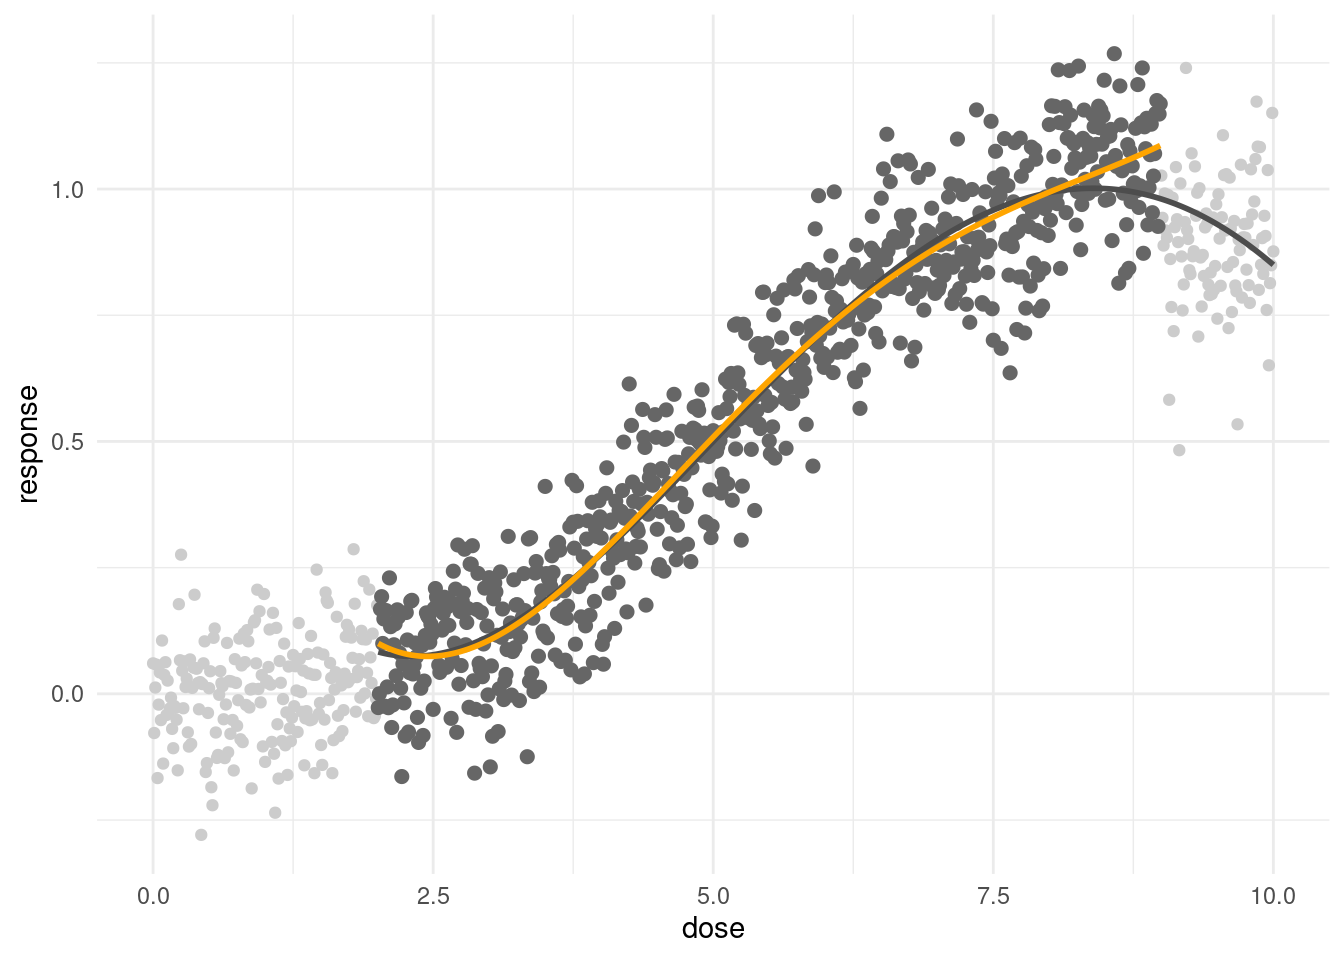
df %>%
  ggplot(aes(x=dose, y=response)) +
  geom_point(color = 'grey80') + theme_minimal()+
  geom_point(data=s3c, color = 'grey40', size =2   ) +
  geom_line(data=s2c, aes(y=predict(s2m1)), color = 'grey30', size = 1) +
  #geom_line(data=s2c, aes(y=predict(s2m4)), color = 'grey30', size = 1) +
geom_line(data=s3c, aes(y=predict(s3m1)), color = 'orange', size = 1) 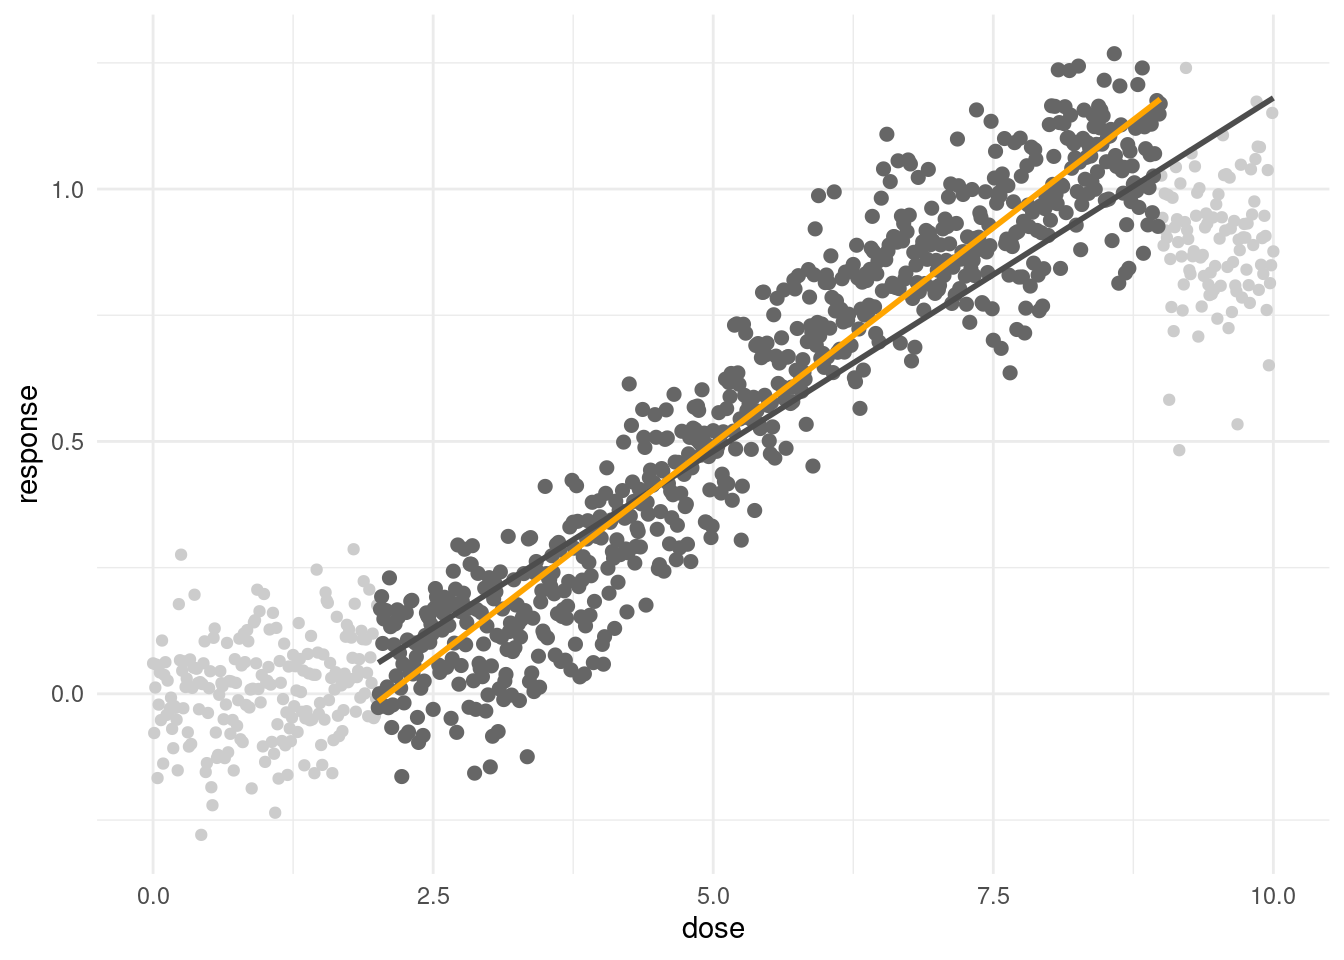
#geom_line(data=s3c, aes(y=predict(s3m4)), color = 'orange', size = 1) 3차 이상의 모형에서는 큰 차이가 나지 않지만, 선형 모형에서는 차이가 상당합니다. 어떤 것이 더 맞다는 것은 아직 논할 단계는 아니고, 차이가 있다는 것을 기억하면 좋겠습니다. 그래서 실제 보고하고 적용할 때 현장에 더 적합한 것이 무엇인지, 목적이 보호 인지, 보상인지 등을 고려하여 해야 겠습니다.
library(gam)
######전체 자료 실습
s4c = df %>% filter(dose <9)
s4m1<-lm(data=s4c, response ~ poly(dose, 1))
s4m3<-lm(data=s4c, response ~ poly(dose, 3))
s4ms<-lm(data=s4c, response ~ sigmoid.f(dose-5))
s4mg<-gam(data=s4c, response ~ s(dose, 20))
anova(s4m1, s4m3, s4ms, s4mg)
## Analysis of Variance Table
##
## Model 1: response ~ poly(dose, 1)
## Model 2: response ~ poly(dose, 3)
## Model 3: response ~ sigmoid.f(dose - 5)
## Model 4: response ~ s(dose, 20)
## Res.Df RSS Df Sum of Sq F Pr(>F)
## 1 898 14.876
## 2 896 10.064 2.000 4.812 233.61 < 2.2e-16 ***
## 3 898 67.272 -2.000 -57.208 2777.26 < 2.2e-16 ***
## 4 879 9.053 18.999 58.219 297.52 < 2.2e-16 ***
## ---
## Signif. codes: 0 '***' 0.001 '**' 0.01 '*' 0.05 '.' 0.1 ' ' 1df %>%
ggplot(aes(x=dose, y=response)) +
geom_point(color = 'grey80') + theme_minimal()+
geom_point(data=s4c, color = 'grey40', size =2 ) +
geom_line(data=s4c, aes(y=predict(s4m1)), color = 'grey10', size = 1) +
geom_line(data=s4c, aes(y=predict(s4m3)), color = 'grey30', size = 1) +
geom_line(data=s4c, aes(y=predict(s4ms)), color = 'deepskyblue', size = 1) +
geom_line(data=s4c, aes(y=predict(s4mg)), color = 'orange', size = 1) 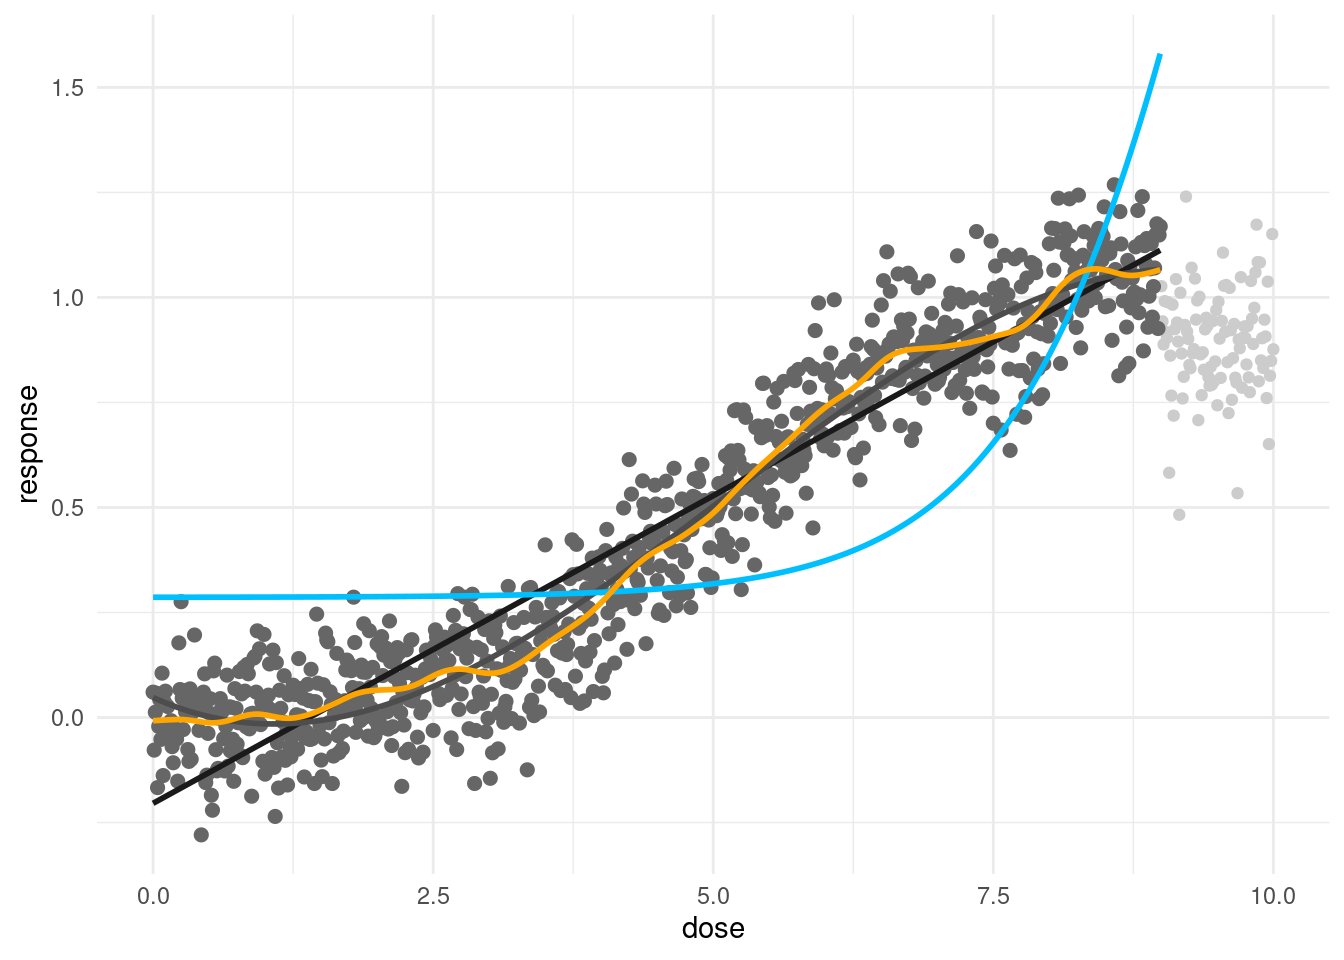
4.6.1 Take home message
high dose exposure cohort: there might be no dose-response relationship (high SMR but no linear relationship)
moderate dose exposure cohort: there were dose-response relationship, healthy worker effect could attenuate those relationship
all dose exposure cohort: there were dose-response relationship, and can control healthy worker effect Over or Underestimation of LD50 can be occured during model selection steps. Best model is not represented of real world, because data generally squared by health worker effect.
create your own model!!!
4.7 Threshold 찾기 (change point 찾기)
reference
threshold를 찾는 방법 중에 threshold point마다, piecewise regression을 반복해서 구하고, 최적의 모델을 찾는 방법을 사용할 수 있습니다. piecewise regression 의 간단한 설명은 다음과 같습니다
| threshold points (piecewise regression) | codes |
|---|---|
| total | Resp = α + β1 · Dose + β2 ·( Dose – Ɵ) + + Ɛ0 |
| If Dose < Ɵ | Resp= α + β1 · Dose + Ɛ0 |
| If Dose > Ɵ | Resp= α - β2 ·Ɵ +( β1 + β2 )· Dose + Ɛ0 |
| model selection | minimal AIC value |
4.7.1 자료 생성
아래 처럼 임로 데이터를 생성해 보았습니다. 어떤 유해물질 노출 (Dose) 에 따라 건강영향 (Resp) 가 나타났다고 생각해 보겠습니다. 그리고 일정량에서 threshold가 있다고 생각해보겠습니다.
set.seed(0)
dose <- seq(0,10, 0.1)
length(dose)
## [1] 101pb<-c(rnorm(50, 0, 0.001), rnorm(30, 0, 0.01), rnorm(10, 0.1, 0.05),rnorm(11, -0.1, 0.05))
resp <-1/(1+exp(-(dose-5)))+rnorm(length(dose), 0, 0.1)+pb
plot(dose, resp, xlab='Dose', ylab='Response', cex.lab=1.5, cex.axis=1.5, cex.main=1.5, cex.sub=1.5)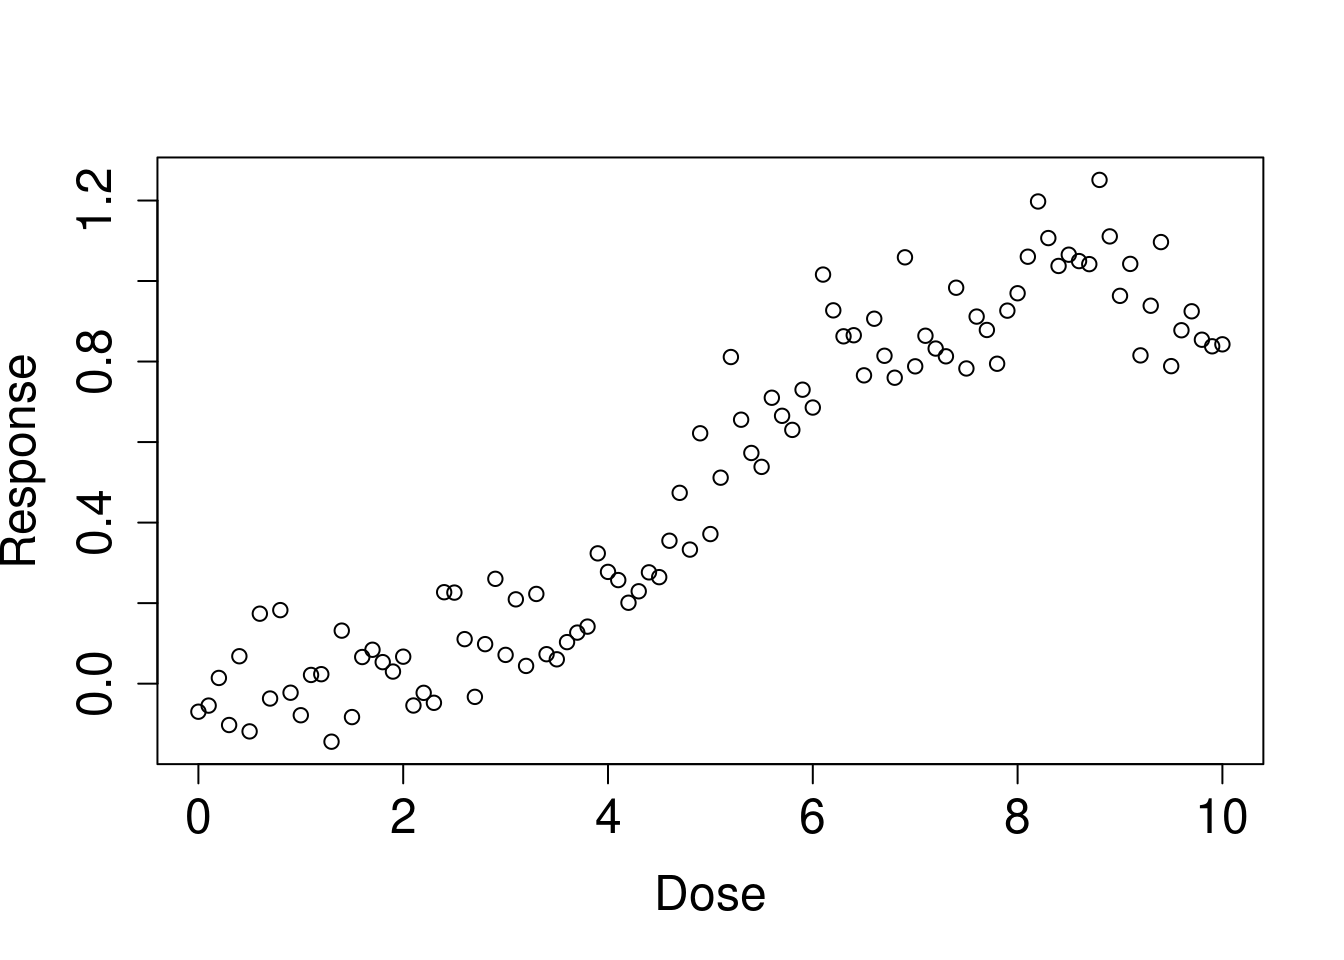
cohort<-data.frame(dose, resp, pb)4.7.2 가상의 threshold 값 수행해보기
한 1에서 5 사이에 있어 보입니다. 이를 통해 예상되는 matrix (outdata)를 구해보았습니다.
outdata의 행의 이름을 threshold point에 따라 intercept, beta for before threshold, and its p value, beta for post threshold and its pvalue와 그때은 AIC 값을 구해보겠습니다 .
우선 하나만 구해보겠습니다. therhold가 1일때와 5일때를 를 가정해 보겠습니다.
cpdose <- ifelse(dose -1 >0, dose -1, 0)
cpm <- glm(resp ~ dose + cpdose)
summary(cpm)$aic
## [1] -92.20184cpdose <- ifelse(dose -5 >0, dose -5, 0)
cpm <- glm(resp ~ dose + cpdose)
summary(cpm)$aic## [1] -86.9744어떤 가정이 모델 적합도를 높이나요? 네 threshold가 1일 때 입니다. 그럼 2랑도, 2.5랑도 비교해 봐야겠지요. 이때 반복 분석을 수행해보도록 하겠습니다.
위의 모델을 함수로 만들었습니다
thr_fun <- function(thres){
cpdose <- ifelse(dose - thres >0, dose - thres, 0)
cpm    <- glm(resp ~ dose + cpdose)
aic    <- summary(cpm)$aic
data.frame(
  'threshold' = thres,
  'aic'       = aic)
}
이것을 돌릴 범위를 정해보겠습니다.
# 이게 어떤 의미 일까요?
dose[which(dose == 1):which(dose == 5)]
## [1] 1.0 1.1 1.2 1.3 1.4 1.5 1.6 1.7 1.8 1.9 2.0 2.1 2.2 2.3 2.4 2.5 2.6 2.7 2.8
## [20] 2.9 3.0 3.1 3.2 3.3 3.4 3.5 3.6 3.7 3.8 3.9 4.0 4.1 4.2 4.3 4.4 4.5 4.6 4.7
## [39] 4.8 4.9 5.0이제 반복해서 작업해 보겠습니다.
simul_list <- list()
simul_list <- lapply(dose[which(dose ==1):which(dose ==5)],                     thr_fun
                     )
이제 데이터 프레임으로 만들어 보겠습니다.
simul_dat <- do.call(rbind, simul_list)그림을 그려보겠습니다.
library(ggplot2)
opt.thres <- simul_dat$threshold[which.min(simul_dat$aic)]

simul_dat %>%
  ggplot(aes(x = threshold, y = aic)) +
  geom_line() +
  geom_vline(xintercept = opt.thres) +
  geom_text(x = opt.thres + 0.8, y = -90, color = 'red',
            label = paste0(round(opt.thres, 3), '점에서 최소 AIC를 보입니다.' )) +
  theme_minimal()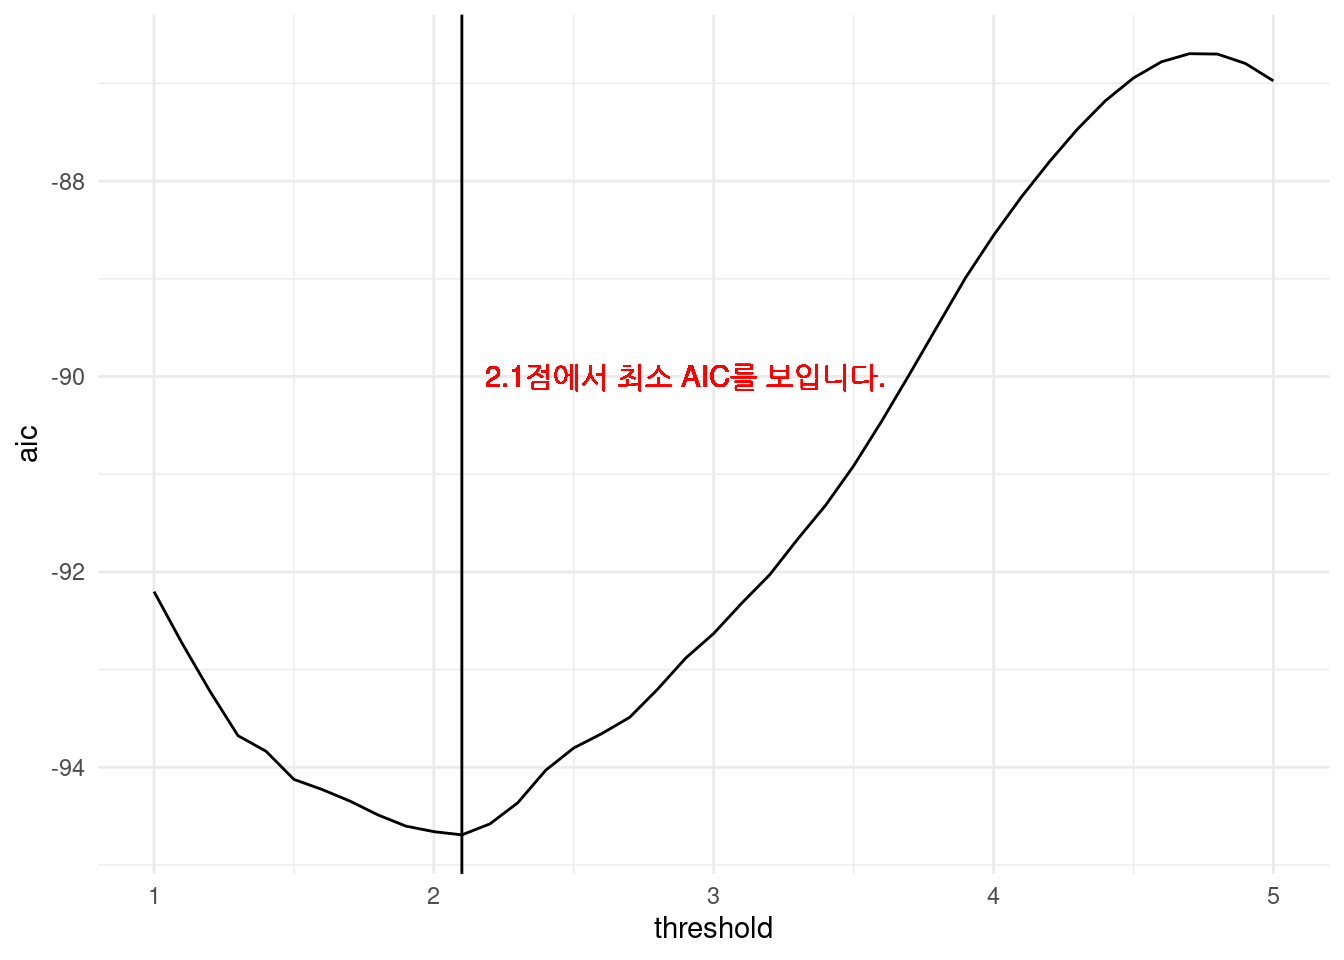
즉 2.1에서 threshold를 잡아 모델을 그리면 가장 적합함을 알 수 있습니다.
thres = 2.1
f_cpdose <- ifelse(dose - thres >0, dose - thres, 0)
f_cpm    <- glm(resp ~ dose + f_cpdose)
prepwlm <- predict(f_cpm)
scaleFUN <- function(x) sprintf("%.2f", x)
cohort %>%
ggplot(aes(x= dose, y = resp)) +
geom_point() +
theme_minimal() +
scale_y_continuous(labels = scaleFUN) +
geom_line(aes(y = prepwlm), color ='red')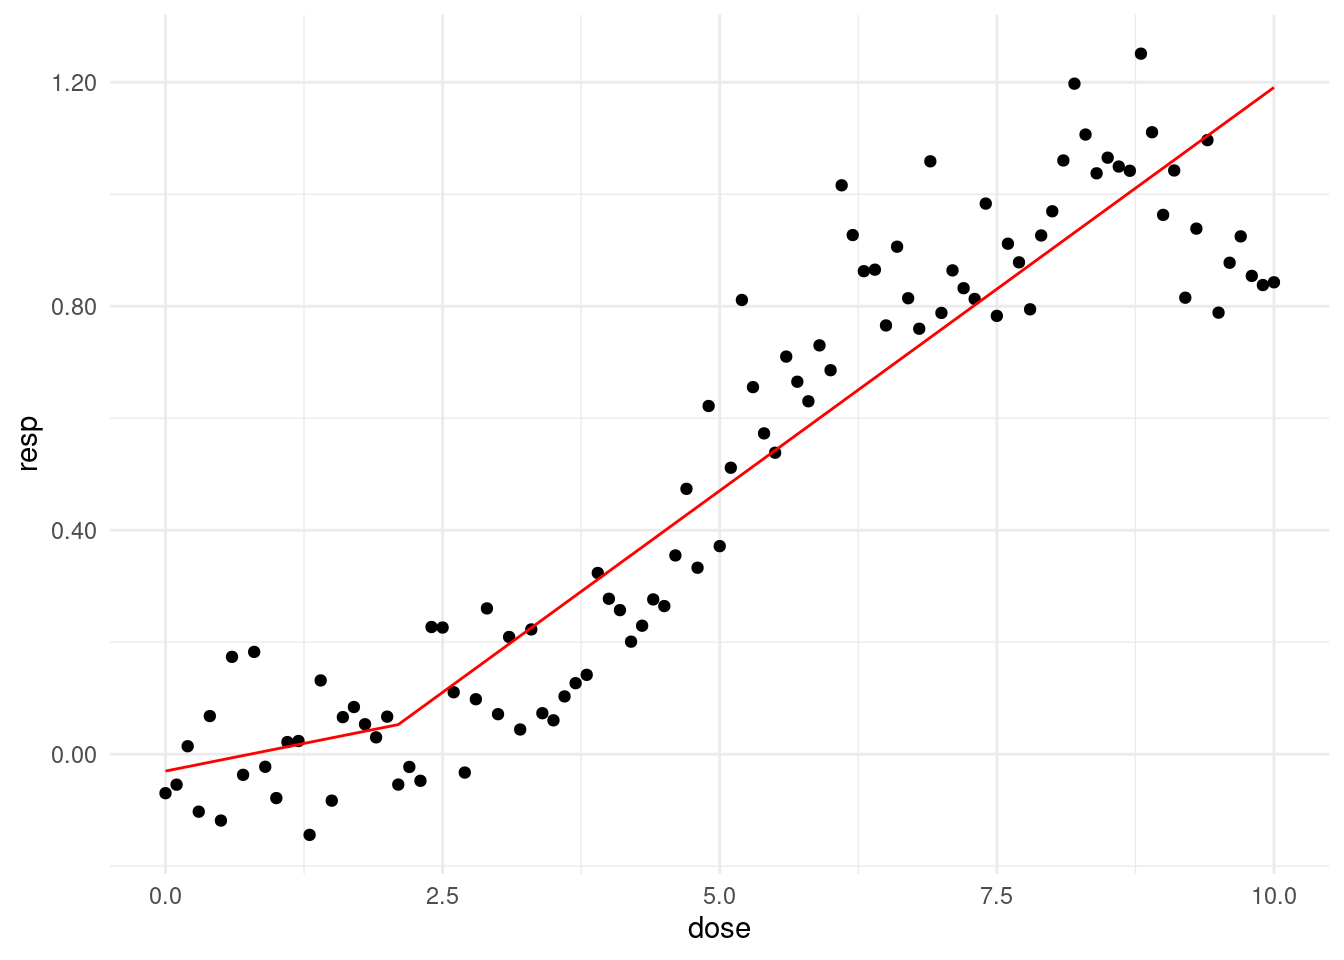
만약 threshold 전에는 질병이 생기지 않는다고 가정하면 어떻게 될가요? dose 대신 predose 를 넣어 주면 됩니다.
thres = 2.1
f_cpdose <- ifelse(dose - thres >=0, dose - thres, 0)
f_predose <- ifelse(dose - thres <=0, 0, dose - thres )
f_cpm    <- glm(resp ~ f_predose + f_cpdose)
prepwlm <- predict(f_cpm)
scaleFUN <- function(x) sprintf("%.2f", x)
cohort %>%
ggplot(aes(x= dose, y = resp)) +
geom_point() +
theme_minimal() +
scale_y_continuous(labels = scaleFUN) +
geom_line(aes(y = prepwlm), color ='red')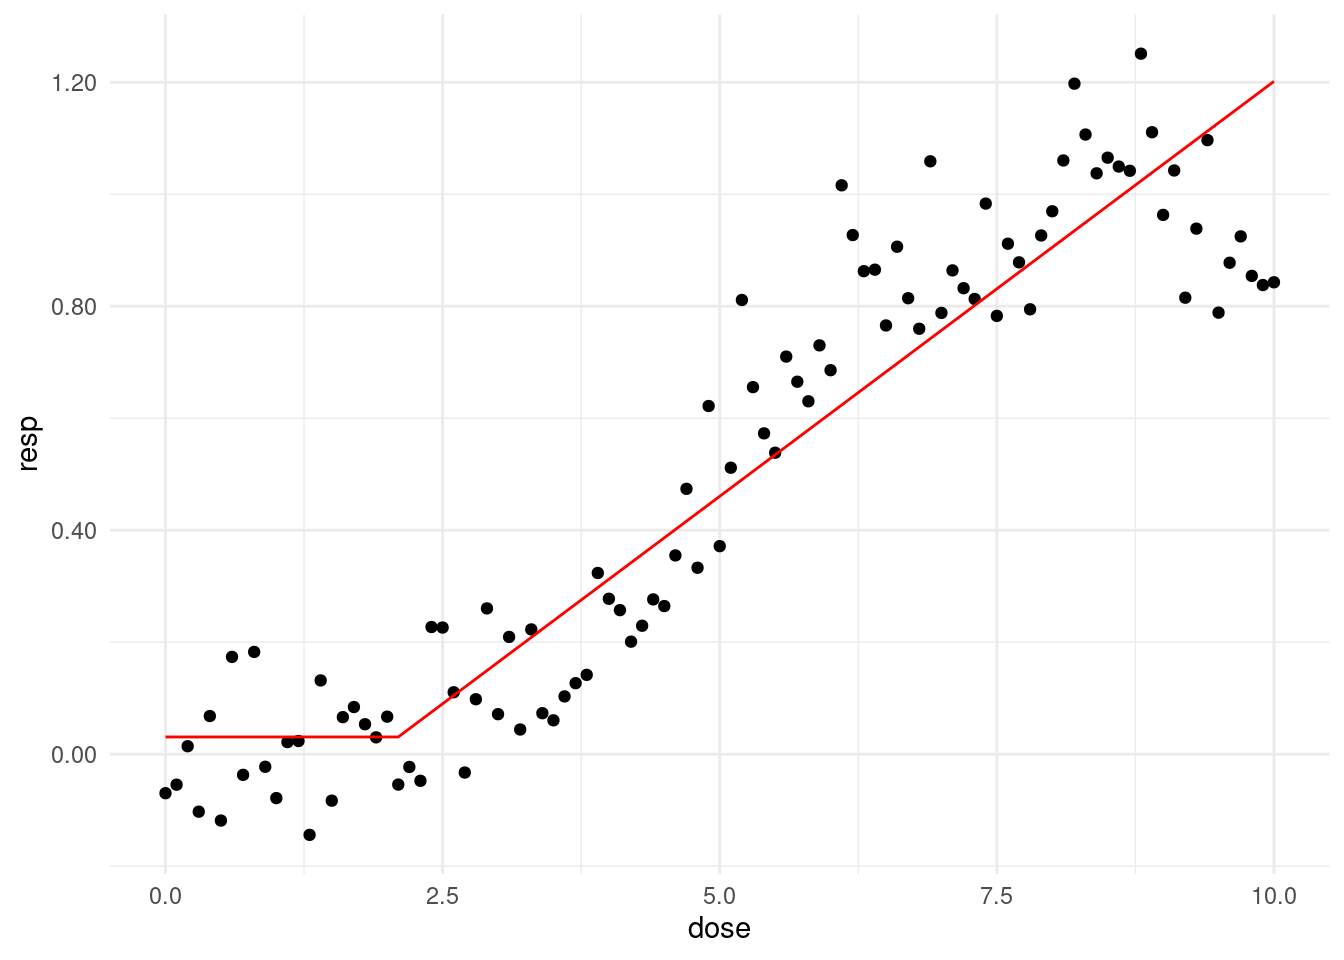
4.7.3 과제
dose가 6부터 10사일에서 change point 가 있다고 가정하고 반복 분석해서 AIC값이 최저인 change point를 찾아 부세요 code를 올려주시면 됩니다.